4 ways to check your financial health

4.7
(3)

This article may contain affiliate links. I could make a small commission if you make a purchase through one of these links, at no extra cost to you. This is how I hope to keep the website up and running for years to come! Please read my disclosure for more info.

Ever wondered where your financial journey should be at your current age? Did you save enough money – or has your lifestyle inflation stumped your path to becoming a millionaire? Curious to try comparing your net worth to others?

Many people have tried to formulate a calculation to determine the proper financial milestones throughout life. Here are 4 ways to evaluate your net worth and my opinion on which one is best.

Be aware that any of the formulae mentioned are just generalized targets and cannot and should not be used to criticize your own net worth, no one formula can reflect an individual situation all around the world. In the end it will all depend on your target retirement age and the target life style you wish to pursue.

“Self-worth takes you further than net worth.”

― Matshona Dhliwayo

The Wealth formula

In the classic book “The Millionaire Next Door”, Thomas J. Stanley and William D. Danko used the Wealth Formula:

Expected Net Worth = (Age ÷ 10) X Gross Income

Using this formula, they categorized people one of three ways:

  • Under accumulator of wealth (UAW) – someone whose net worth is less than 50% of the expected net worth.
  • Average accumulator of wealth (AAW) – someone on par with the expected net worth
  • Prodigious accumulator of wealth (PAW) – someone with a net worth at least 2x the expected level; a builder of wealth.

Thomas J. Stanley wrote an update “The Millionaire Mind” where it seems 10 was increased to 11.2. In 2018, “The Next Millionaire Next Door” Sarah Stanley Fallaw finished the sequel, that she has started with her father Thomas J. Stanley, after he died in 2015. Currently, I have yet to read either sequel, but looking into it for this article it seems the formula has remained unaltered. 

Beyond the original authors, the money guy show did suggest an alteration to combat the difficulties using this formula for those in the early years of their career. They suggest a modification for those below 40 to take the years left until 40 and add it to the 10. Someone at the age of 32 should for example divide their age by 18 (40 – 32 = 8; 10 + 8 = 18). A good addition, I believe.  

Net Worth target

The Wealth formula gives a nice indication where one fits in a category based on age, but it assumes everybody starts earning money at the same time and gross income to remain stable over the years. It therefore does not work very well for those that have just entered the workplace and those that have seen significant changes in income recently.

The Net worth Target formula instead takes the years in the workplace to replace age and looks at the average gross income over those years, instead of the current gross income as this might vary of the years. This arranges a formula as followed:

Net Worth Target = Years Working X Average Gross Income X 0.25

The same three categories can of course still be applied, but this formula does make it a fairer comparison, you can’t build wealth that you haven’t had the opportunity to earn yet. Although it might work less well for those with years of experience and higher than average income.

Although used often online, the origin of this formula is unclear to me, the earliest version I can find is in 2011 by James M. Dahle the White Coat Investor. I will attribute it to him, until someone can correct me.

Financial Philosophies Favorite:

The capital-to-income ratio

Last but certainly not least, another way of looking at the expected net worth at a certain age is the capital-to-income Ratio from “Your Money Ratios: 8 Simple Tools for Financial Security” by Charles Farrell. You can use the table from his book (see below) as a simple ratio for your gross income divided by your net worth. 

Capital to income ratio

This formula takes into account a different saving power by age – one of the main reasons this would be my favorite way to calculate your expected net worth. The main limitation here would be that – like the other formulae – is that it is created for a retirement at 65 years, and starting at the age of 25 (it doesn’t work very well below 24 years of age).

Enough with the philosophies!

If you just need cold hard numbers – below are the latest available Dutch and U.S. income and net worth numbers – and you can look where your peers are standing.

Gross income & Net Worth by Age category

Interestingly, gross income in both countries are very similar (except for the early years) – net worth is about 50% higher for the U.S. population though, probably due to a different way of determining net worth.

Comparing philosophies

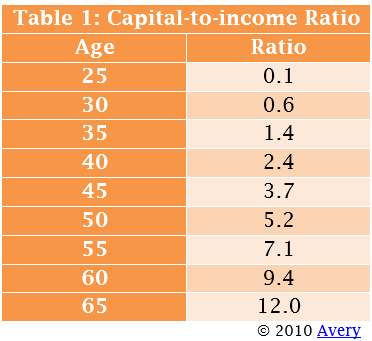
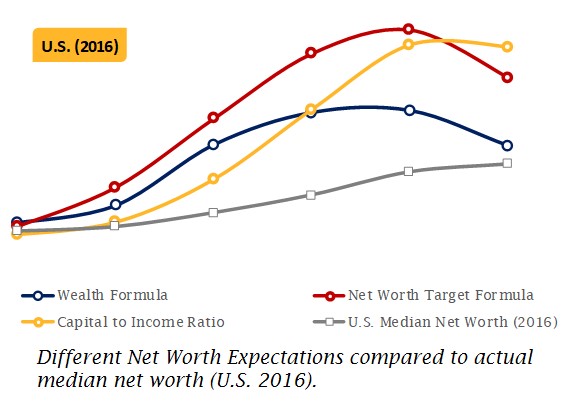
Using the median gross incomes together with the median age (25 ≤ 34 gives 29.5; ending at age 79.5) of the population given in the table above we can begin to make a comparison of the four formulae in the graph below (U.S. shown, Dutch gives exactly the same trend). First thing to note is that the Wealth – and Target formulae don’t handle the decrease of income in retirement (after 65) very well, also the Capital to Income Ratio is built to work until age 65, so it is not surprising that it too breaks its trend after this age.

Overall, I think that the Capital to Income Ratio works best – with a nice S-curve allowing people at a young age to build up slowly. In contrast to both the Wealth – and Target formula which see an almost linear increase from the start albeit one steeper as the other (difference in savings rate). Using the Money Guy modification (used in graph), the Wealth formula is improved to also show more of an S-curve for the early years.

Comparing Net Worth Philosophies

Charles Farrell’s Capital To Income Ratio combines to slower build up in the early years of the Wealth Formula with  the higher end net worth of the Net worth Target Formula giving an expected net worths at the age of 69.5 for each as follows:

  • Wealth formula: 282,719 (for an average accumulator of wealth)
  • Networth Target Formula: 503,402
  • Capital to Income Ratio: 601,405 (14.8x gross income)

One last remark to make – none of these formulae are made for the median population – as illustrated in the graph with the U.S. median net worth lagging far below the calculated expectations (the Dutch are even lower). Creating an expectation that if you’re following any of these formulae, you should at the very least end up in the upper 50% of the population!

Which formula do you like? Are you a prodigious accumulator of wealth?

How useful was this post?

Click on a star to rate it!

Average rating 4.7 / 5. Vote count: 3

No votes so far! Be the first to rate this post.

As you found this post useful...

Follow us on social media!

We are sorry that this post was not useful for you!

Let us improve this post!

Tell us how we can improve this post?

Leave a Comment

This site uses Akismet to reduce spam. Learn how your comment data is processed.