
This article may contain affiliate links. I will make a small commission if you make a purchase through one of these links, at no extra cost to you. This is how I hope to keep the website up and running for years to come! Please read my disclosure for more info.
The world of personal finance is flooded with beautiful and sometimes (often) complex worksheets – which assume a certain level of expertise in using Microsoft Excel or its equals. This creates a lot of room for error for those less experienced with these kinds of programs and with that a serious bias in who has appropriate access to these ((un)necessary) tools. This is why, instead of creating just another version of the same complicated worksheets – I provide easy-to-use worksheets with limited access to prevent unnecessary (mistaken) modifications.
With this being said, hoping that every sheet can be used without much explanation, I do feel the need to provide access to some sort of manual for each of my worksheets for those still uncomfortable with using them. If after all this, you still have questions or missing something – reach out! info@financialphilosophies.com.
Last side note: I avoid the use of currency, to make any sheet applicable to your local situation – this does mean that you should try to avoid mixing different currencies into one worksheet though! I would love to think Rp 15,000 is the same as € 15,000 – but sadly this is not the case!
““Never take your eyes off the cash flow because it’s the lifeblood of [the household].”
– Richard Branson [modified]
Why download this?
A Cashflow statement tells you where you money comes from and where it is going, making a cashflow statement is important because it teaches you a lot about yourself. These lessons are learned so much better when going through your finances manually. Making a cashflow statement using automatic (online) programs teaches the software companies a lot about you and your habits. Making a cashflow statement by hand teaches YOU a lot about you and your habits! This workbook just makes it easier to do this manually.
A cashflow statement will surely help you with your financial plan, keep track of where your money went and is key to the secret to building wealth! Make no mistake, a cashflow statement is important even if you make a lot of money, there are plenty of 6-figure salaries that go to waste. Lifestyle inflation is a real risk to your journey to financial freedom.
Send download link to:
Navigating the workbook
This workbook consists over various tabs of which the core is predictably divided into 01 to 12, representing the months of the year (see picture). For me, 01 is January – but for you it might be October; you have the freedom to choose.
On the top left of each tab you can add the starting date of that particular month (see also the picture of ‘Money – IN’ below).
Next to the months there is also tab giving an annual overview – a convenient place with all months in a single place for those that wish to keep a simple overview (explained further down).
Lastly, there is one tab that is purely illustrative to provide assistance without the need of going back to this article and that is the ‘Example’ tab where you can find a detailed explanation on how to fill a particular month (using example numbers). I will use this tab to illustrate throughout this article.
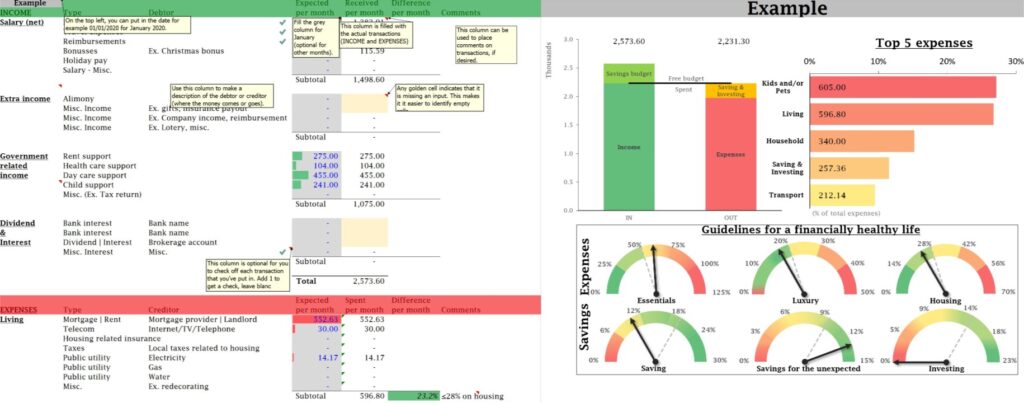
Any particular month will look like the example shown above. With the inputs on the left, Money coming IN (green) on the top and Money going OUT (red) on the bottom, and the output on the right, explained in detail below.
This article explains primarily on how to work with this particular workbook – want to know what to add and not to add to a cashflow statement? Check out this article!
Send download link to:
The input - Money IN
Let’s get started with the input, in particular the incoming money. As I’ve mentioned previously, the top left gives you the opportunity to add a starting date for your record – this will also be shown above the output (by default month 01 is January).
The incoming money is divided into various streams.
- Salary (nett)
- Extra income
- Government related income
- Dividend & Interest

Each category and subcategory can be interpreted as you like, but overall I’d feel that they are quite self-explanatory. Ignore those that are not relevant – contact me if you feel something is wrong or missing. You can personalize it with the name of which ever organization or person that is giving the money to you in the ‘Debtor’ column.
The Grey ‘Expected per month’ column gives you a place to put your expected income for that subcategory and the following ‘Received per month’ can be used for the actual amount received. If there is a difference between the two numbers it will be given for you in the ‘Difference per month’ column (Red if you got less than expected, black if more than expected). The last column gives you some space to add comments, to for example explain a difference.
When filling out what has been received, it is possible to add checkmarks before the Grey cells by putting in the number 1. This can help you to keep track of which income you’ve already put in correctly. In addition, for those working in newer versions of Excel (I believe 2016 and up), numbers in the ‘Received per month’ column will have different colors depending on whether you’ve filled them in manually (hardcoded, blue) or by using a formula (black). Use this to your advantage when double checking your numbers. Combined these two options give a good opportunity for quality control.
Last feature to mention, in the ‘Received per month’, you can find that unfilled cells light up in gold to signal where input is still lacking, making it easier to identify. Usually what I do is that I make a reference to my expected month until I have actually received it – but you might like to keep it empty. By default this reference is already placed there, as well as a reference for every month to the previous month, allowing you to start with only filling out month 01 (try it out!).
Send download link to:
The input - Money OUT
Let’s continue with the unavoidable money going out. Again, various categories and subcategories have been created – again contact me if you feel something is wrong or missing. As with debtors previously, you can customize here the ‘Creditors’ column. The expectations (grey cells) and the real expenses can be added again in their respective columns where now the difference will pop-up red if you’ve spent more than expected and black if it’s less than expected.
Comments are free to be added for your records to remember why those expenses were so high or low, or fun!? With one exception – I added a note to remind you to ‘Pay yourself first!’ in the saving & investing subcategories. It just didn’t feel logical to put those expenses on top – but I also did not want you to think that those investments into your future should be done so late in the list of expenses. Yes, I do feel that they should be listed as expenses to avoid saving to be a passive hobby – it is a bill to pay for your future happiness.
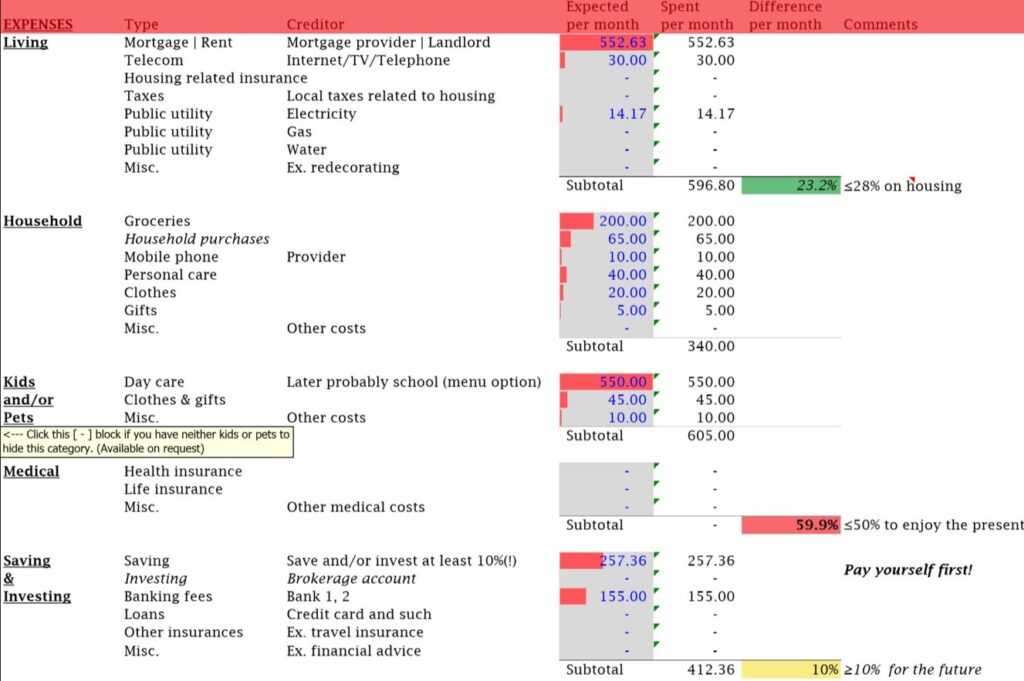
Next to the subtotal of some categories, I have also added some guidelines to show how your expenses are going. For example, in the picture above, the guideline is that you should spend no more than 28% of your monthly income on housing (I take the % of total net income). If you are within this range it will show up green highlight or if you are exceeding this guideline it will highlight in red as shown for the 59.9% spent on essentials (including housing). Want to know more about these guidelines? Check them out here!
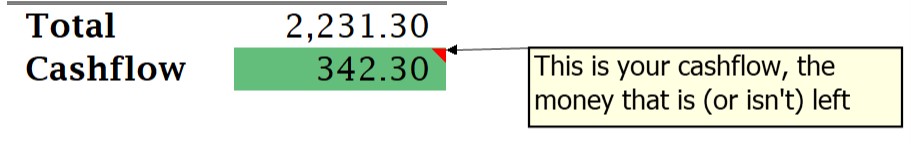
At the bottom of the expenses, you’ll find the total and the end result of a cashflow statement, the cashflow. Which is either highlighted in Green when you’ve spent less than you’ve made, or in Red when you’ve overspend for that particular month.
Send download link to:
The output - Graphs
That’s all the input (and some output) for any particular month. Now let’s take a look at the graphical output that is created for you on the right side of the worksheet. The outputs are divided in to three collections. An overall overview, a scoring of your expenses and some gauges to give you guidelines on how well you are handling your finances. Let’s start on the top left with the overall overview.
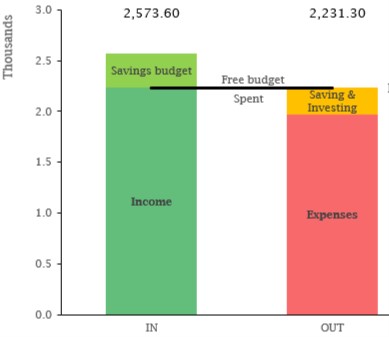
In the overall overview, you see a bar graph with two bars – one for money coming IN and one for money going OUT. A simple enough representation of what we just filled out. On the top you find the numerical value of how much went IN and OUT. Each bar is divided into two parts, for the IN bar you have a darker green named ‘Income’ which represents the amount of the income that is equal or lower than the value of how much went OUT. The lighter green area called ‘Savings budget’ is the positive cash flow (or passive savings) that is left on top of the expenses. In between you find a line which separates the money ‘Spent’ and the money still available in the ‘Free budget’.
This line is on top of the total expenses of the OUT bar, which is subdivided into the red ‘Expenses’ or all the bills paid and the orange ‘Saving & Investing’ (or the active savings). Here you can see that in each bar the top area refers to some form of savings. The minimum requirement you’d like to fulfill is that the red bar is equal than the dark green bar, everything else is (glorious) extras.
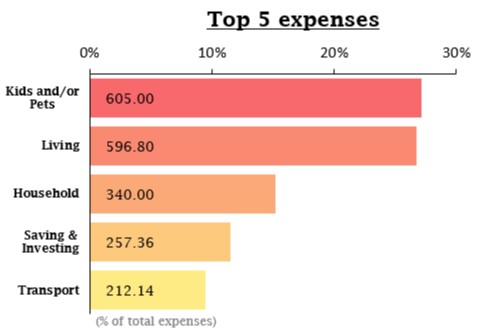
Moving to the right we have a bit more of a dynamic table illustrating your Top 5 Expenses. The highest category is always listed on top and anything out of the top 5 isn’t listed at all – as I feel you’d need to focus on the big fish and not the small fry. When reading the graph, you’ll find the numerical value to how much you’ve spent on a particular category given inside the associated bar. The size of the bar shows you how big that particular category was in your overall spending. In the example above the spending in the category ‘Household’ took approximately 15% of the total amount of expenses, which means that 15% of your bills fit into this particular category.
This graph shows you where your priorities lie – if your top expense is Leisure time, and it’s 60% of your total, while saving & investing is nowhere to be found – you know that financial independence is not your priority right now. The numbers don’t lie. Speaking of priorities, the last section can tell you all about it!
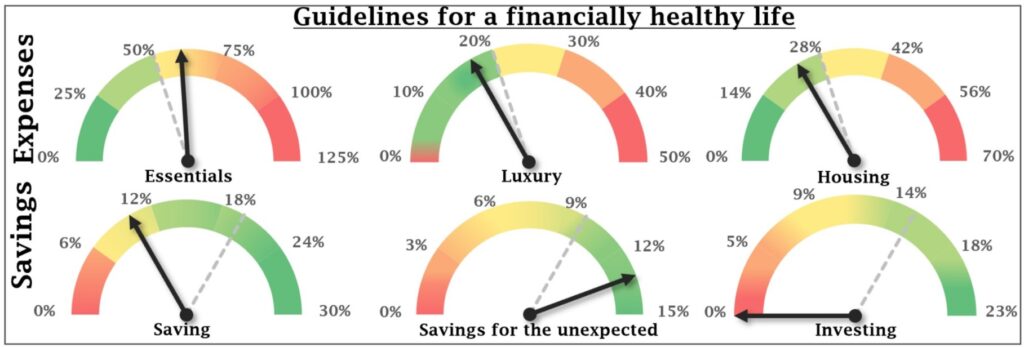
This last part of the monthly overview provides you with gauges following the guidelines for a healthy financial life. It provides you with 6 gauges, divided into ‘Expenses’ (top) and ‘Savings’ (bottom). Each gauge has a grey, dotted line representing the guideline to maintain (i.e. max. 50% spent on ‘Essentials’). Each gauge has a color gradation, green is good, red is bad an everything in between – naturally you’d like to stay in the green, preferably close to the guideline. I also wanted to highlight in the ‘Luxury’ gauge, that spending on too little fun and luxury is also not a good thing – so you’ll find red at the bottom of both sides of the spectrum.
The gauges, ‘Essentials’, ‘Luxury’, ‘Saving’ and ‘Savings for the unexpected’ follow the 50/20/20/10 rule – with ‘Savings’ being the active savings (the orange part of the money OUT bar mentioned above), and the ‘Savings for the unexpected’ being the passive savings (the light green part of the money IN bar mentioned above). The ‘Housing’ gauge is again following a 28% guideline and the investing follows a minimum of 15% as a guideline.
Just try to keep them in the green!
Send download link to:
The output - Annual overview
Now let us leave the monthly view and head over to the annual overview tab where you can find each month. I have limited the options here to only seeing the income, expenses and cashflow obtained from the sheets 01 through 12. Below this you can find your savings rate for that particular month (or year in the ‘Total’ column). Below that you can find the cumulative savings and investments, which includes active and passive savings and any contributions towards investments. Lastly, you can add any remarks you might have for that particular month.

Below the table you’ll find a graph illustrating the same information – with the income in a green bar, expenses in a red bar for every month (left y-axis), and the cumulative savings for that year in the golden line (hopefully going up, right y-axis).
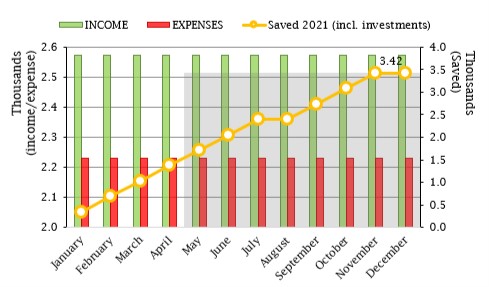
You’ll see that part of the graph is greyed out if you’ve filled out the current year in the top left of the table above – this shows you which months are still in the future (and therefore uncertain). If you put a year in the past, all will be white and logically a year in the future will be all grey.
BIRTHDAY BONUS
As a last bonus, not really finance related, but still fun to have – I think. The annual overview gives you a nice birthday calendar which allows you, while filling out your monthly expenses, to check upcoming birthdays! Be that friend that remembers all the birthdays! They don’t need to know it’s Excel telling you – it’s probably saver than social media!

It works exactly as you’d expect – it has every month and all the days of that month. With one little extra, that is – it tracks the current date, highlighted in green. So you’ll always know whose birthday is next! All you need to do is fill in the names of those you wish to celebrate.
That’s it! My favorite workbook – a financial diary to use for years to come! Have you been using one before? Please tell me what you think of this download below, I’d be very curious!
Send download link to:
How useful was this post?
Click on a star to rate it!
Average rating 5 / 5. Vote count: 1
No votes so far! Be the first to rate this post.
We are sorry that this post was not useful for you!
Let us improve this post!
Tell us how we can improve this post?