
This article may contain affiliate links. I will make a small commission if you make a purchase through one of these links, at no extra cost to you. This is how I hope to keep the website up and running for years to come! Please read my disclosure for more info.
You ever wondered what your standing is in the world when it comes to finance? Want to have a feeling of how rich or poor you are? Or perhaps you feel rich or you feel poor, but are you really? Well chances are, reading this on the internet you might be richer than you think – globally – but let me take it into perspective of the western world; the Netherlands specifically in this case.
“99 percent of all statistics only tell 49 percent of the story.”
– Ron DeLegge II
Introduction
Who doesn’t get romantic with graphs and statistics? Well maybe its just me and a few exceptions.. It is common in most relationships for one partner to take the lead in managing the families finances. Ours is no different and you might have guessed that I take a bigger role in maintaining our financial numbers. But as communication is a big factor for success in any relationship, I do try to communicate our progress often and at least once a year try to present my partner with a good review of the past year.
However, numbers alone mean very little to someone that isn’t exposed to them often in such a fashion. This is why I try to put them into perspective, as I feel perspective works for everyone. Perhaps you can use some perspective for yourself or your partner, for this I can present with some graphical overviews of (the most recent) available data on income and net worth in the Netherlands.
Income
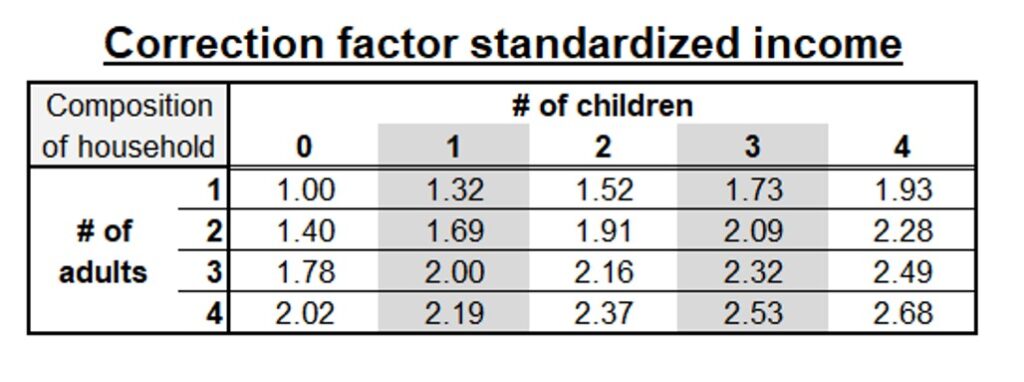
Let’s start with looking at income. It is easy to find out how much money you make, it says so right there on your salary slip. However, the power of your currency is quite dependent on how many people need to be fed with that money. There is a certain scalability when you at money, money becomes more efficient when you are in a shared household compared to being a single person. Heating costs are the same for the same room, but if you have two people in that room – both only have to use a part of their hard earned money to pay for it. Similarly, it is cheaper to buy in bulk, cooking for a family is cheaper than a dinner for one. This makes it all very complicated to simply compare one salary slip to another. This is where the standardized income comes in (see box and table).
The importance of standardized income and what it means: To make a fair comparison between one person and the next, it is important to take into account the composition of someones household. To do this, there are correction factors used depending on how many adults and children take part of your household (see table below). Obviously a single person with no kids needs no correction, 30.000 is 30.000, but once you have a two parent family with one child the same income does not constitute the same level of wealth per person (actually 1.69x less).
Once you’ve standardized your family income, you can find out in the curve below how ‘average’ you family income is. For example 2 adult parents of one both earning the Dutch 2019 median income of 35.000 would have a standardized income between 40.000 and 42.000 on the graph and is actually quite a bit right of center. Two adults earning the median income are already doing exceptionally well!

How average is your household income? Are you surprised? I know I was! I mean, the fact that there are negative numbers on this graph alone already surprised (and saddened) me! Want to put into a global perspective? Have a look here, or take a stroll through dollar-street and find out how people live around the world for different monthly spending habit (highly recommended!)
Net Worth
Next up, Net Worth! I have already delved into Net worth by age previously (incl. worksheet), explained you how to determine you net worth (including another wonderful worksheet). It is a great number to keep track off, but what does it actually tell you if you put it into a ranking. Are you part of the 1%?
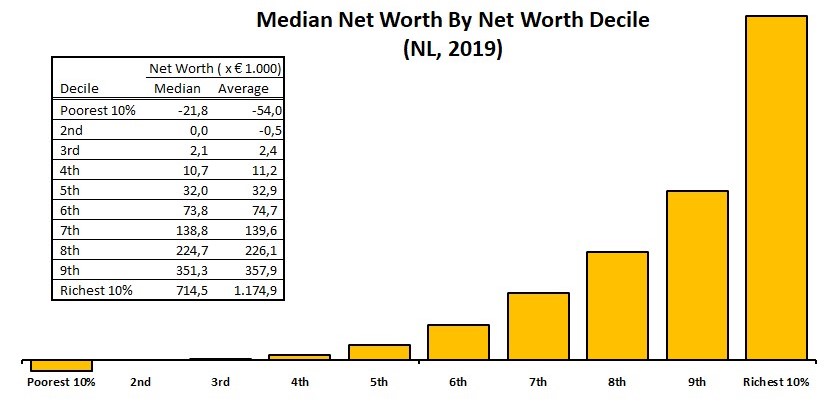
The graph above is a visual representation of the data in the table insert, what it doesn’t tell you, but you could guess is that the richest 10% of the Netherlands owns approximately 60% of the total wealth in the Netherlands, a nice ‘Did You Know?’
The table insert gives next to the Median net worth also the average, as an illustration that in the extremes (top and bottom 10%) the averages are skewed quite a lot by the outliers. Overall, the median and average are quite similar showing that these are relatively homogeneous groups.
Now, if you’ve determined your net worth and you, for example, found that you have a net worth of 75.000; you can say that you are worth more than 50% of the Netherlands (in 2019), in the top 50% of the country! The Netherlands owned about 1,03% of the worlds wealth in 2019, #15 in the world! Sadly, a website that would give you a good global comparison is no longer online, but again the dollar-street gives a good indication how rich your life looks like in comparison.
Do you have a new perspective on your wealth? Feel richer or poorer now you know this? Please let me know in the comments below!
How useful was this post?
Click on a star to rate it!
Average rating 0 / 5. Vote count: 0
No votes so far! Be the first to rate this post.
We are sorry that this post was not useful for you!
Let us improve this post!
Tell us how we can improve this post?