
This article may contain affiliate links. I will make a small commission if you make a purchase through one of these links, at no extra cost to you. This is how I hope to keep the website up and running for years to come! Please read my disclosure for more info.
The world of personal finance is flooded with beautiful and sometimes (often) complex worksheets – which assume a certain level of expertise in using Microsoft Excel or its equals. This creates a lot of room for error for those less experienced with these kinds of programs and with that a serious bias in who has appropriate access to these ((un)necessary) tools. This is why, instead of creating just another version of the same complicated worksheets – I provide easy-to-use worksheets with limited access to prevent unnecessary (mistaken) modifications.
With this being said, hoping that every sheet can be used without much explanation, I do feel the need to provide access to some sort of manual for each of my worksheets for those still uncomfortable with using them. If after all this, you still have questions or missing something – reach out! info@financialphilosophies.com.
Last side note: I avoid the use of currency, to make any sheet applicable to your local situation – this does mean that you should try to avoid mixing different currencies into one worksheet though! I would love to think Rp 15,000 is the same as € 15,000 – but sadly this is not the case!
“Retirement is when you stop living at work and start working at living.”
– Anonymous
The worksheet – Retirement Grid
Many people are curious on when they can retire with their current saving habits, and there are some calculators on the web. But they either use fixed assumptions or they are not good in aiding the understanding visually. With this worksheet, I try to get the best of both worlds.
Central in this worksheet is form where you can fill out your information, which will then show a written result next to it (part 1). With the input provided the retirement grid will start to form itself to show you visually what your options are (part 2).
It is important to note that this sheet will assume your income and expenses remain in balance throughout life, ensuring a constant amount of savings added to your retirement savings.
Send download link to:
The data – Part 1
As you’ll open the worksheet for the first time, you will notice golden cells that indicate you where your input is required. Outside of these golden cells, there are only two other cells that can be altered, discussed in the description of part 2.
The first three pieces of information requested are financial, the first being your annual after tax income (what comes into your bank account per year), the second your annual expenses (what goes out of your bank account per year, the third requests to get the amount you’ve saved so far for retirement. The first two will be used to calculate your annual savings rate to determine how much will be added to the third every year.
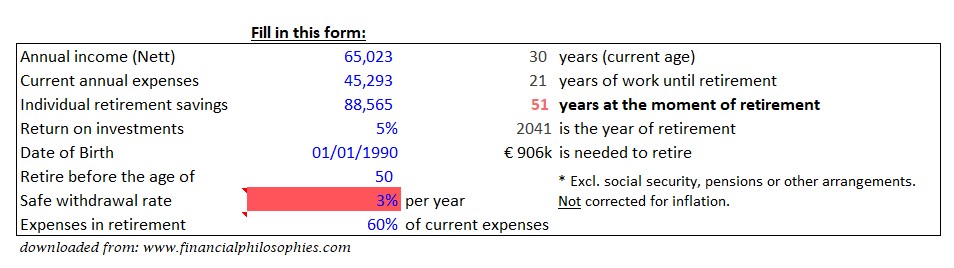
The fourth piece of information is your expected return on investments (in %), or interest rates, should reflect a realistic expectation. Many people, like Dave Ramsey, talk about double digit returns in the stock market – but this just isn’t a safe bet to take. Add to this the prediction that the stock market was doing great the last decade, but it won’t do so great the next it is best to temper your expectations. Lastly, this worksheet does not take into account inflation, if you want to bring this into the equation you can solve this by artificially downgrading your return on investments. For example, if you expect an annual return of 7%, but that inflation will run at 2% a year – fill in an annual return of 5%.
The next is simply your date of birth to determine your current age and to be able to give back your expected retirement date, age and how many years left until you’ve reached this point (all given on the right side of this form). Below this you can give your desired retirement age. If your expected retirement age is higher than your desired retirement age, the age of retirement will turn red (see example).
Safe withdrawal rate (in %) is how much of your retirement savings you will use per year to life, the higher the rate the more you’ll need to save to accommodate this. Usually considered around 4% in the American literature, 3% seems more reasonable in the Netherlands. Either way – when your withdrawal rate does not allow you to maintain the level of expenses from the age of retirement (this example 50 years) until death (average life expectancy is 85 years) – it will fill up with red to indicate that this age is too early to retire, unless you can live on less money by reducing your withdrawal rate.
Lastly, you can decide how much your current expenses will reflect your expenses after retirement (in %). Depending on your lifestyle choices, perhaps you’re a fan of pre-paying the mortgage, or you’re simply retiring at an age after the mortgage is paid off – life can be a lot cheaper in retirement. Most retirement systems are actually counting on it, with an expectation to have expenses ranging from 70-80% of your pre-retirement expense. Social security can pick up a part of this, when available.
All together, the column on the right will provide all your personal output – concluding with an indication of the lump sum that would need to be saved to obtain your wishes.
(If you wish to primarily use Part 2; you can opt out to add your current income, expenses (in retirement) and your desired age of retirement, this will however limit the full functionality of the worksheet.)
The visualization – Part 2
After filling out the requested information the retirement grid starts to form, so let’s have a look at what we will be looking at. At the bottom, from left to right, you’ll have your annual after tax salary earned, with the first value available to edit to your liking. Similarly, on the right side, from the bottom up you’ll find the annual spending with the first value available for editing. Values are abbreviated to thousands, meaning 10.000 equals 10k. If you’ve filled out your income and expenses in the previous section these will be highlighted in green and red respectively, and highlight the whole row and/or column with a red line (see example).
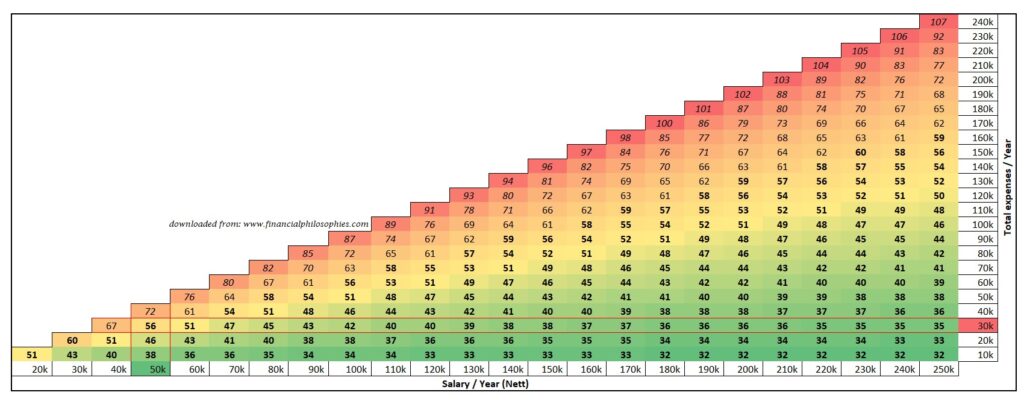
The next obvious feature is the color gradient, ranging from green (earlier age) to red (later age), which indicate which areas are below or above your desired retirement age (if filled out). Red cells are above your desired retirement age – meaning you’ll need to go to the right (earn more) or drop down (spend less) to get into the green (or increase your retirement age). Less obvious perhaps is the numbers indicated in bold (or not) – this is a small reminder for those eager for early retirement – bold numbers are 60 or lower (above 60 years of age isn’t really early retirement, or is it?).
Send download link to:
Final Remarks
Hopefully this tool for (early) retirement visualization can give you some insights into the effect of earn more (moving your income to the right) or spending less (moving your expenses down). Whatever your desired age of retirement is – try to get into the green.
Have any suggestions for improvement or things that you feel are missing? Let me know in the comments below!
Send download link to:
How useful was this post?
Click on a star to rate it!
Average rating 5 / 5. Vote count: 10
No votes so far! Be the first to rate this post.
We are sorry that this post was not useful for you!
Let us improve this post!
Tell us how we can improve this post?